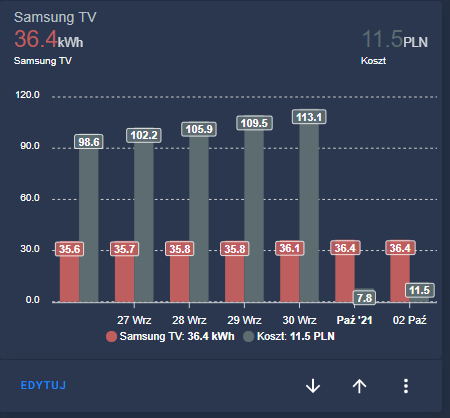
Polecam bardzo fajny dodatek do tworzenia wykresów i graficznej prezentacji danych w kartach lovelace.
Do tej pory używałem głównie mini-graph-card, ale ten dodatek zdecydowanie bardziej mi się podoba. To moje przykładowe wykresy:
Polecam bardzo fajny dodatek do tworzenia wykresów i graficznej prezentacji danych w kartach lovelace.
Do tej pory używałem głównie mini-graph-card, ale ten dodatek zdecydowanie bardziej mi się podoba. To moje przykładowe wykresy:
Apex card Wykres słupkowy

Kod:
type: custom:apexcharts-card
graph_span: 7d
span:
  end: day
header:
  show: true
  title: Samsung TV
  show_states: true
  colorize_states: true
apex_config: null
now:
  show: false
  label: jetzt
  color: '#bf5e5e'
series:
  - entity: sensor.gniazdko_tv_samsung_energy
    type: column
    name: Samsung TV
    color: '#bf5e5e'
    group_by:
      func: last
      duration: 1d
    show:
      datalabels: true
  - entity: sensor.house_cost_monthly
    type: column
    name: Koszt
    color: '#5c6c70'
    group_by:
      func: last
      duration: 1d
    show:
      datalabels: true
Hejka w jaki sposób liczysz koszty
---
platform: template
sensors:
  house_cost_daily:
    friendly_name: 'Dom Całkowity Koszt Dzienny'
    icon_template: mdi:currency-eur
    value_template: >-
      {{
      (
      (states('input_number.energy_daily_price')|float) +
      (states('sensor.house_electricity_daily_peak')|float * states('input_number.energy_price_peak')|float) +
      (states('sensor.house_electricity_daily_offpeak')|float * states('input_number.energy_price_offpeak')|float)
      )
      | round(2)
      }}
    unit_of_measurement: "PLN"
input_number
---
energy_price_offpeak:
  name: Cena energii za kWh (Poza Szczytem)
  mode: box
  min: 0
  max: 100
  unit_of_measurement: "PLN/kWh"
  icon: mdi:currency-eur
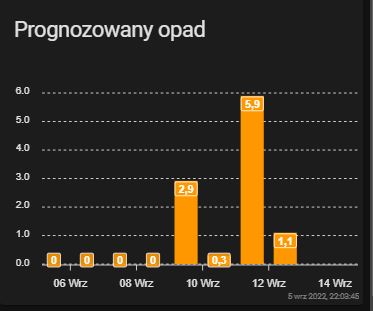
Witam, czy ktoś potrafi przesunąć daty pod wykresem aby były wyświetlane poprawnie ?

Kod:
type: custom:apexcharts-card
graph_span: 8d
span:
  start: hour
apex_config:
  dataLabels:
    enabled: true
series:
  - entity: weather.openweathermap
    type: column
    data_generator: |
      return entity.attributes.forecast.map((entry) => {
        return [new Date(entry.datetime), entry.precipitation];
      });
    show:
      datalabels: true
header:
  standard_format: true
  show: true
  title: Prognozowany opad
show:
  last_updated: true