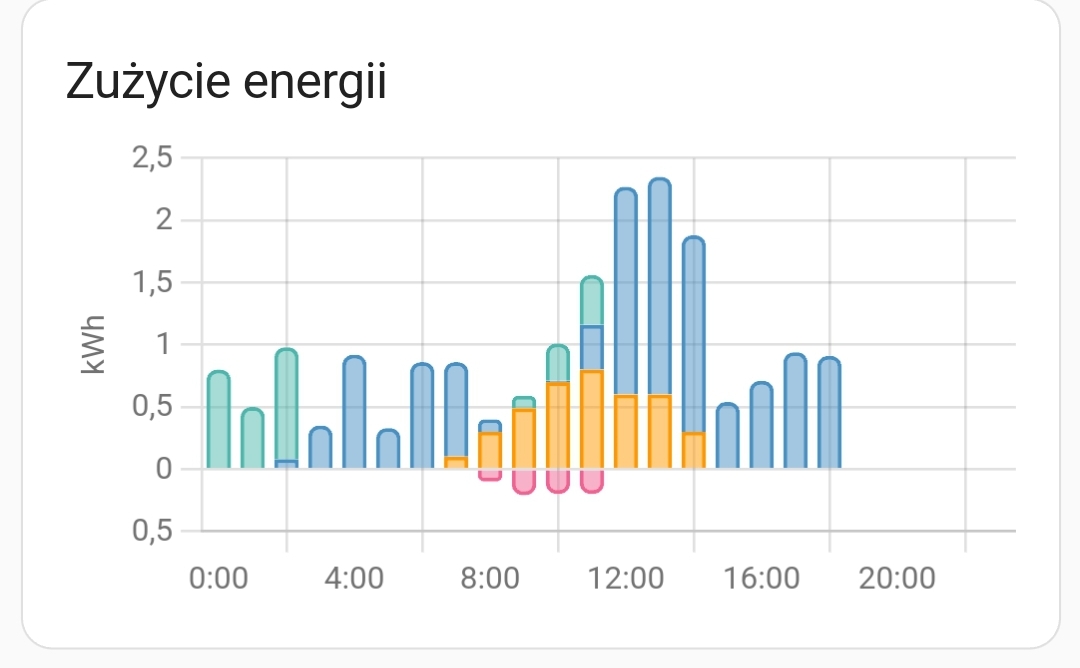
Czy znacie sposób jak posortować inaczej dane na wykresie poniżej?
Czyli niebieskie muszą zawsze się od.zera.zaczynać a potem reszta.
1 polubienie
GSzabados
4 Listopad 2024 20:39
2
Partial solution:
Hello, I am trying to find a way to have a graph in a form of “stacked” bars or lines to represent how each sensor contributes to the overall value. A tipical use case is this: 1 - one sensor representing the consumption from the grid 2 - one...
Reading time: 1 mins 🕑
Likes: 14 ❤
Otherwise, you need to dig into this to change the order:
import type {
  ChartData,
  ChartDataset,
  ChartOptions,
  ScatterDataPoint,
} from "chart.js";
import { endOfToday, isToday, startOfToday } from "date-fns";
import type { HassConfig, UnsubscribeFunc } from "home-assistant-js-websocket";
import type { CSSResultGroup, PropertyValues } from "lit";
import { css, html, LitElement, nothing } from "lit";
import { customElement, property, state } from "lit/decorators";
import { classMap } from "lit/directives/class-map";
import memoizeOne from "memoize-one";
import { getEnergyColor } from "./common/color";
import { formatNumber } from "../../../../common/number/format_number";
import "../../../../components/chart/ha-chart-base";
import "../../../../components/ha-card";
import type { EnergyData } from "../../../../data/energy";
import { getEnergyDataCollection } from "../../../../data/energy";
import type { Statistics, StatisticsMetaData } from "../../../../data/recorder";
pokaż oryginał
Thanks for tips. Probably I will dig into ts file.
1 polubienie