Średnia z Ilości godzin w domu

Hej, zrobiłem sobie history stats tak jak tutaj:

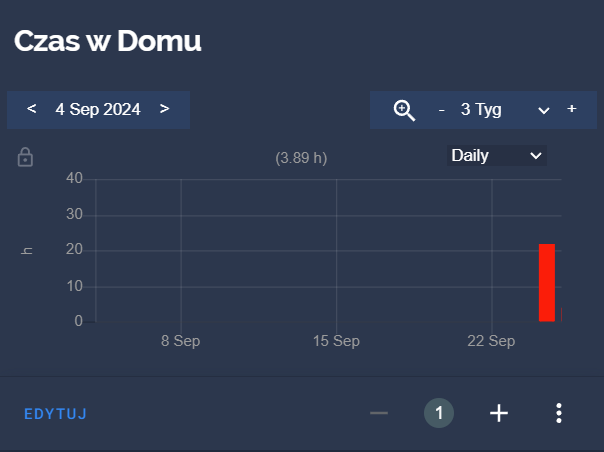
Ładnie pokazuje mi jak długo dziennie byłem w domu,
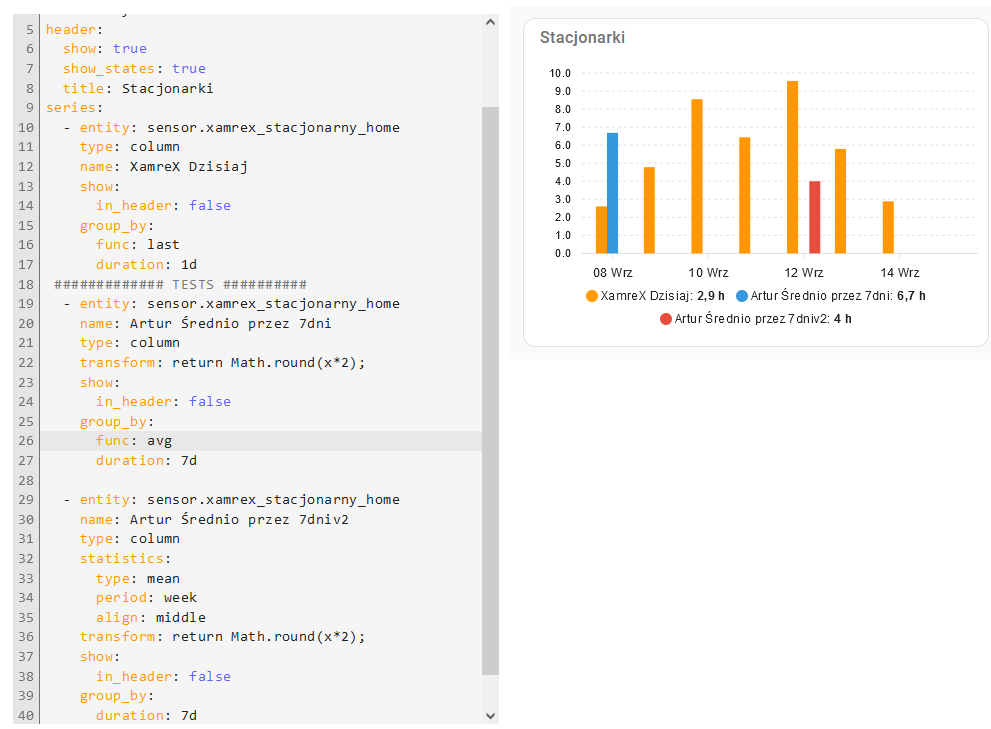
Chciałbym teraz wyświetlać również średnią wartość przez jaki czas byłem w domu w ciągu 7 dni.
W terorii jest to proste, bo wystarczy zsumować wartości poszczególnych dni, i podzielić przez 7, ale kompletnie nie mam pojęcia jak to zrobić.

Próbowałem samym ApeXCharts, ale nie bardzo mi to działa:
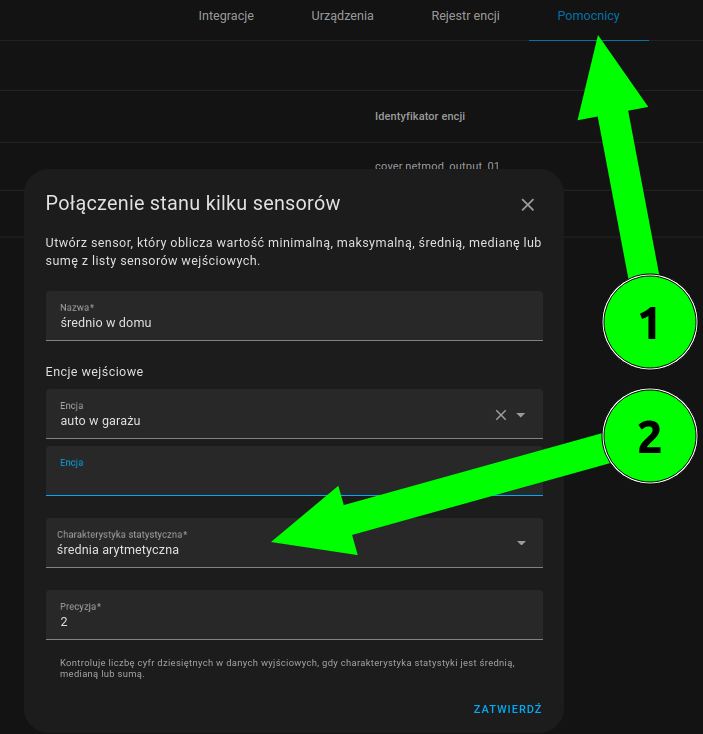
Próbowałem jakiś tempate sensor stworzyć, ale tez nie chce mi to działać.
Jak do tego podejść?

Prawidłowa wartość powinna wynosić 5.8h

Spróbuj z pomocnikiem:

Nic to nie działa.
Przez ostatni tydzień nie było mnie w domu.
Dzisiaj wróciłem i jestem 5 godzin.

Zrobiłem sobie w teorii sensor który zwraca mi ilość czasu jaką byłem w odmu w ciągu 3 dni. ale to nie działa:

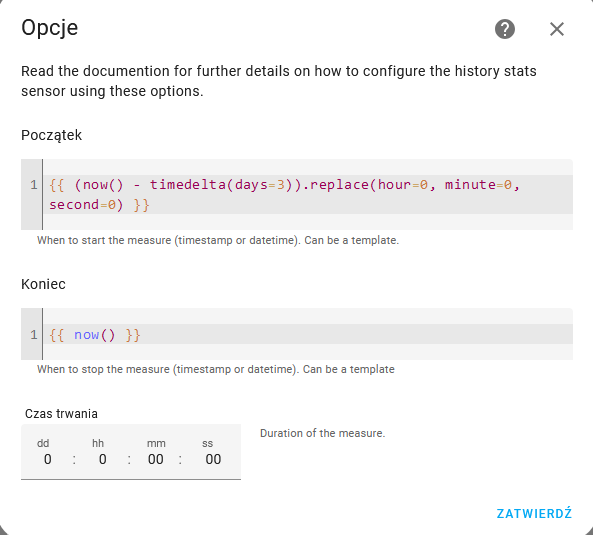
Mam wartość te ~5 godzin, niezależnie czy ustawię timedelta na 3 dni, jeden dzień, czy po prostu wpiszę:
{{ now().replace(hour=0, minute=0, second=0) }} wartość zwracana to zawsze te 4:53

obraz

Chat GPT podpwoiedział, że mogę sobie stworzyć 7 sesnorów, gdzie każdy będzie mierzył maksymalną wartość z danego dnia. cos jak:

sensor:
  - platform: history_stats
    name: Max Value Day 1
    entity_id: sensor.your_sensor
    type: max
    duration: '24:00:00'
    end: "{{ now() - timedelta(days=0) }}"

  - platform: history_stats
    name: Max Value Day 2
    entity_id: sensor.your_sensor
    type: max
    duration: '24:00:00'
    end: "{{ now() - timedelta(days=1) }}"

  - platform: history_stats
    name: Max Value Day 3
    entity_id: sensor.your_sensor
    type: max
    duration: '24:00:00'
    end: "{{ now() - timedelta(days=2) }}"

  - platform: history_stats
    name: Max Value Day 4
    entity_id: sensor.your_sensor
    type: max
    duration: '24:00:00'
    end: "{{ now() - timedelta(days=3) }}"

  - platform: history_stats
    name: Max Value Day 5
    entity_id: sensor.your_sensor
    type: max
    duration: '24:00:00'
    end: "{{ now() - timedelta(days=4) }}"

  - platform: history_stats
    name: Max Value Day 6
    entity_id: sensor.your_sensor
    type: max
    duration: '24:00:00'
    end: "{{ now() - timedelta(days=5) }}"

  - platform: history_stats
    name: Max Value Day 7
    entity_id: sensor.your_sensor
    type: max
    duration: '24:00:00'
    end: "{{ now() - timedelta(days=6) }}"

a potem template sensor, który obliczy średnią:

sensor:
  - platform: template
    sensors:
      average_max_value:
        friendly_name: "Average of Last 7 Max Values"
        value_template: >
          {% set values = [
            states('sensor.max_value_day_1') | float,
            states('sensor.max_value_day_2') | float,
            states('sensor.max_value_day_3') | float,
            states('sensor.max_value_day_4') | float,
            states('sensor.max_value_day_5') | float,
            states('sensor.max_value_day_6') | float,
            states('sensor.max_value_day_7') | float
          ] %}
          {% set valid_values = values | select('is_number') | list %}
          {% if valid_values | length > 0 %}
            {{ (valid_values | sum / valid_values | length) | round(2) }}
          {% else %}
            0
          {% endif %}

Ale czy nie ma lepszego podejscia?

sensor:
  - platform: history_stats
    name: Czas w domu
    entity_id: person.xxx
    state: "home"
    type: time
    start: "{{ now().replace(hour=0, minute=0, second=0) }}"
    end: "{{ now() }}"

  - platform: history_stats
    name: Czas w domu tydzień
    entity_id: person.xxx
    state: "home"
    type: time
    start: "{{ (now() - timedelta(days=7)).replace(hour=0, minute=0, second=0) }}"
    end: "{{ now() }}"
1 polubienie
platform: history_stats
name: Czas w Domu ON
entity_id: binary_sensor.sm_g781b_wifi_state
state: 'on'
type: time
start: '{{ now().replace(hour=0).replace(minute=0).replace(second=0) }}'
end: '{{ now() }}'

Zamiast type: time możesz użyć ratio będziesz miał procentowy wykres.

Kod History history-explorer-card

custom:history-explorer-card

type: custom:history-explorer-card
cardName: historycard
tooltip:
  showLabel: false
statistics:
  enabled: true
  mode: mean
defaultTimeRange: 3w
header: Czas w Domu
uiLayout:
  toolbar: top
  selector: hide
graphs:
  - type: bar
    title: ' '
    options:
      interval: daily
    entities:
      - entity: sensor.czas_w_domu_on
        name: ''
        color: rgba(255,0,0,1)
        fill: rgba(255,0,0,0.15)

Screenshot - 25.09.2024 , 03_54_13